Start with the workflow the software must support
Trading chart software is one part of an operating workflow, not an isolated screen. The workflow commonly moves from obtaining market data to charting prices, applying technical analysis, and executing trades. A price chart visualizes activity during a period such as five minutes, 30 minutes, or one day; each period generally includes opening, high, low, and/or closing prices. Your shortlist should therefore begin with the work the system must support, the instruments it must cover, and the people who will use it.
Market-data requirements depend on the instrument. Before investing, you need to know the prices of the stocks, futures, or currencies you intend to trade. Stock and futures prices usually come from exchanges, while forex does not have a central exchange. That distinction affects the questions you ask about data origin, timing, symbols, aggregation, and entitlement. Do not treat a chart interface as proof that the underlying feed is complete, accurate, real-time, or suitable for your operating purpose.
Write the operating brief before comparing products. Record the following items:
- Users: research analysts, discretionary traders, execution staff, risk teams, developers, or operations personnel.
- Instruments: equities, futures, currencies, or a defined combination of markets.
- Task: monitoring, historical analysis, alerting, simulated trading, live execution, reporting, or application embedding.
- Time horizon: intraday, daily, weekly, or longer-term analysis.
- Environment: browser, desktop, internal application, broker terminal, or a mixed setup.
- Control boundary: who may access data, change indicators, send orders, deploy code, or approve production use.
A tool that satisfies a researcher but cannot support the execution, data, or control requirements of the wider workflow is not a complete fit. Use the brief as the reference point for every later comparison.
Match chart forms and time horizons to the user task
Chart form should follow the question you need to answer. Traders typically use line, bar, and candlestick charts when reading stock charts. A line chart is the simplest form and is typically constructed from a stock’s closing price, so it offers a quick view of a longer-term trend. A bar chart provides the open, high, low, and close for each time period. A candlestick chart also shows the open, high, low, and close, while its body represents the range between opening and closing prices and its wick or shadow shows the high and low.
Use the following test when reviewing chart controls:
- Choose a line chart when a compact view of closing-price direction answers the question.
- Choose a bar chart when the full open-high-low-close record for each period matters.
- Choose a candlestick chart when the relationship between opening and closing prices and the period’s high and low needs to remain visible.
- Test whether the system lets users switch chart forms without losing symbols, studies, drawings, or saved layouts.
- Check whether the interface supports the time intervals required by the workflow rather than assuming that a long list of intervals means the data is available at each interval.
These are presentation choices, not trading instructions. A visual pattern does not establish that a trade will be profitable.
Timeframe is another fit question. A longer-term trader may use a weekly or monthly chart, while a shorter-term trader may use a 60-minute or 5-minute chart. Map each user task to a required interval, then test whether the product preserves the same instrument, timezone, session definition, and studies when you move between intervals. If several teams will use the system, document their needs separately instead of selecting one timeframe as a compromise for everyone.
A practical chart-form matrix can use four columns: user task, required price fields, preferred visual form, and acceptance test. For example, a trend-monitoring task may need closing prices and a line view; an intraday review may need all four price fields and a candlestick or bar view. The acceptance test should use representative instruments and intervals from your own workflow. Record what the software displays, what it omits, and whether the result can be saved and reproduced by another authorized user.
Separate visual analysis from indicator and automation needs
Indicators and drawing tools should be evaluated against a defined analytical task, not counted as a feature total. Charting packages usually offer basic technical-analysis indicators; more advanced packages may add extra indicators and the ability to back-test strategies. Volume and moving averages can be used with price action, and a moving-average crossover may be a sign that momentum has shifted from bullish to bearish or vice versa. Interactive Brokers’ Trader Workstation is described as containing advanced technical-analysis tools with over 120 indicators; that figure measures the indicators described for that platform, not the quality or suitability of any individual indicator.
Translate the analytical requirement into testable fields:
- Studies: Which indicators are required, and can users configure their inputs and display rules?
- Drawings: Can users add, move, label, hide, and save trend lines, levels, or annotations?
- Volume: Does the view identify the relevant contract, instrument, or aggregation basis?
- Alerts: Can an authorized user define the condition, recipient, timing, and audit record?
- Layouts: Can teams save and restore a consistent workspace without overwriting another user’s configuration?
- Back-testing: What data, adjustment rules, lookback period, and symbol history feed the test?
- Automation: What code can run, where does it run, and who can approve a change?
A feature belongs in the shortlist only when you can connect it to a user task and an acceptance test. A large indicator catalog does not answer whether the required data is available or whether the resulting workflow is governed.
Non-time-based chart types may serve narrower analytical tasks. Point-and-figure charts remove time and focus on price movement in one direction, using Xs for upward moves and Os for downward moves. Tick charts are most useful for futures and stock traders when trade frequency is high. In slower forex pairs they can be inconsistent, although during major market sessions or announcements they may help examine momentum and execution timing. Treat these forms as explicit requirements to test, not as universal improvements.
An API changes the evaluation from screen functionality to system behavior. Some trading software may include an API for developing trading strategies and may offer automated-trading capabilities for day trading. Ask whether the interface supports the instruments, historical fields, events, order states, authentication model, rate limits, error handling, and environment separation your application requires. If back-testing or automation is in scope, keep the code-development requirement separate from the charting requirement and require a controlled test path before production use.
Test responsiveness, access, and included workflow components
Responsiveness is a workflow requirement when users must act on changing prices or manage an order. Evaluate whether the software lets users enter and exit positions swiftly, and check reviews for execution-speed red flags. Test the full path rather than timing only the chart: data arrival, screen update, user action, order transmission, status response, and recovery after a failure. A fast-looking chart does not by itself establish fast or reliable execution.
Access architecture creates a different set of trade-offs. Web-based software requires an internet connection and usually has zero installation, update, and maintenance costs. Complex algorithms may require installable software, which is usually more expensive. Compare browser and desktop options by the actual operating task:
- Test browser access on the networks and devices your team will use.
- Test desktop installation, update responsibility, local dependencies, and recovery procedures.
- Record whether a disconnected session can preserve work or whether the workflow stops.
- Identify which users need administrative rights, local files, or specialized hardware.
- Test accessibility requirements for keyboard use, text scaling, contrast, focus order, and any assistive technology used by your team.
The result should describe an operating boundary, not a general preference for web or desktop software.
Check whether the charts, data feeds, news sources, and market access your workflow needs are included as standard. A listed chart feature may depend on a separate plan, broker connection, market-data entitlement, region, or exchange agreement. StockCharts refreshes its charts on a 5-15 second delay rather than continuously charting real-time prices. That 5-15 second figure measures the stated chart refresh delay, not every StockCharts function or every plan. Record the timing that applies to the exact product configuration you are testing.
Use a repeatable performance test with the same instrument, interval, network condition, account configuration, and action sequence for each shortlisted tool. Capture timestamps and failure behavior. Include symbol changes, multiple panels, indicator recalculation, alert delivery, order-state updates, and a temporary loss of connectivity. If the product is for analysis only, omit execution testing but keep the data-arrival and recovery tests. Make the boundary explicit so a charting result is not presented as an execution result.
Use a vendor-evidence comparison matrix
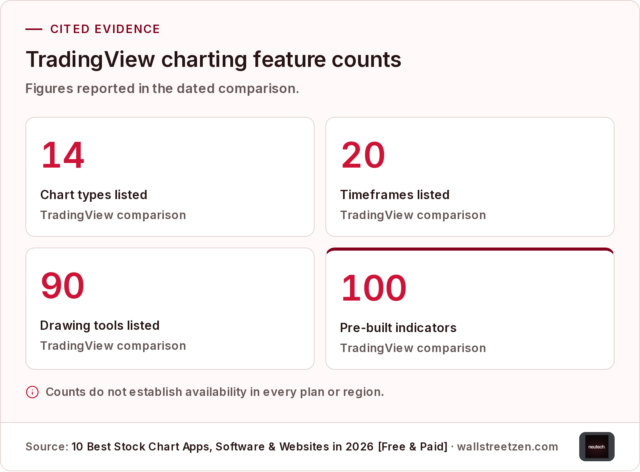
Vendor-specific descriptions belong in a separate evidence layer from general capability requirements. TradingView has 14 chart types, 20+ timeframes, 90+ drawing tools, and 100+ pre-built indicators. The figures measure the chart types, timeframes, drawing tools, and pre-built indicators listed in that comparison. They do not establish that every item is available in every plan, region, market, or integration.
TradingView can chart fundamental data from income statements, balance sheets, cash-flow metrics, and statistics, and has 100,000+ community-built indicators. The 100,000+ figure measures the community-built indicators reported by that comparison; it is not a count of indicators validated for your workflow. Treat community content, fundamental fields, and charting controls as separate test categories.
Build one row per product and one column per decision field. Use these columns:
- Charting: forms, intervals, studies, drawings, layouts, alerts, and accessibility.
- Data: instruments, exchanges or sources, timing, history, adjustments, volume, open interest, and symbol limits.
- Connectivity: broker, API, export, execution, simulated trading, and recovery behavior.
- Commercial access: plan, entitlement, user, device, region, and redistribution conditions.
- Operations: administration, support, updates, monitoring, audit records, and ownership.
- Governance: approval, testing, privacy, security, compliance responsibility, and change control.
- Evidence status: documented, demonstrated, unresolved, or rejected.
Use a separate note for every dated vendor claim. Do not convert a vendor description into a general capability, and do not let an attractive feature count conceal an unresolved data or control dependency.

Compare access models and product trade-offs
Access model often determines the first shortlist branch: independent browser charting, a broker-connected platform, a watchlist tool, a swing-chart service, or a broker terminal. The table below records each product’s positioning and limitations; use it as a starting point for testing, not a universal ranking.
| Product | Stated fit and access model | Stated limitation or dependency | Listed starting or plan detail |
|---|---|---|---|
| thinkorswim | Full platform | Requires a Schwab brokerage account and a heavy desktop app | $0 to start; no funding minimum to use it |
| TradingView | Browser charting with no brokerage attached | 2 indicators per chart and ads; paid tiers are region-priced | $0 to start |
| Webull | Broker with charts, free real-time Level 1 data, and execution | Level 2 depth costs $2.99/mo | $0 to start; the passage describes trades as commission-free |
| Finviz | Building a watchlist before the open | Delayed data, no intraday charts, and ads | $0 to start; Elite is $39.50/mo |
| StockCharts | Daily and weekly swing charts, annotation, and ChartLists | No intraday charting on its free plan | $0 to start; Basic is $19.95/mo |
| MetaTrader 5 | Broker terminal for traders whose broker already runs MT5 | The broker decides symbol coverage; a broker account is required for data | Access depends on the broker account |
The listed prices and limits apply to the configurations described in the table. They are not a complete cost model. Separate the interface price from brokerage charges, exchange or data fees, paid access to depth or history, user seats, device restrictions, tax treatment, integration work, and internal support. A $0 starting price can still leave a required dependency, such as a brokerage account, a desktop installation, delayed data, or a broker-determined symbol set.
Use the access model to narrow the next test:
- If you need independent browser analysis, test the required chart, data, and indicator entitlements without attaching a brokerage account.
- If execution is part of the workflow, test the broker account, order path, symbols, data timing, and account permissions together.
- If the task is pre-market screening, test whether delayed data or missing intraday charts changes the decision.
- If the task is daily or weekly review, test saved annotations, lists, history, and team sharing.
- If the broker already runs a terminal, test the broker’s actual symbol coverage, data rights, and operational support rather than assuming the terminal supplies every market.
End each branch with a demonstrated acceptance result or a documented reason to remove the product from the shortlist.

Verify broker connectivity, data history, and symbol coverage
Broker connectivity must be tested as a configured integration, not inferred from a product name. Sierra Chart documentation for its Interactive Brokers integration lists streaming real-time data, a limited amount of historical intraday data, historical daily data, live trading, simulated trading, and all order types. Interactive Brokers’ platforms are described as offering extensively customizable charting, over 100 indicators, and real-time streaming data. Each statement applies to the documented platform or integration named in its source.
Historical depth can differ by source and feed. Interactive Brokers provides 1 year of historical daily data, while Sierra Chart’s historical-data service can provide 10+ years for major futures contracts, cash indexes, and US stock symbols when using a Sierra Chart real-time data feed. The 1-year figure measures the stated Interactive Brokers historical daily availability, and the 10+ years measures the stated Sierra Chart service availability for the named instruments and feed condition. Do not merge them into one generic history claim.
Run the integration test against the instruments and actions that matter to your workflow:
- Confirm the exact symbol format, primary exchange, contract, currency, and session.
- Compare live, delayed, simulated, and historical views for the same instrument.
- Test each required order type in the permitted environment and record the returned status.
- Measure the available lookback for intraday and daily intervals separately.
- Check whether volume and open interest represent one futures contract or all contracts.
- Confirm whether a historical setting applies to intraday data, daily data, or both.
- Repeat the test after a disconnect, reconnect, symbol change, and session transition.
Sierra Chart documents that an all-contracts volume and open-interest setting applies only to historical charts and may omit current-day volume. That limitation changes how you interpret a historical chart and must remain beside the result.
Scale and licensing constraints can appear only after the basic connection works. Interactive Brokers may limit the number of symbols that can receive data at the same time, and that limit may increase based on trading volume. Sierra Chart documents that each user should have a separate account and that an account can by default be used on 2 computer systems concurrently, or up to 3 systems depending on the service package. Those counts measure the documented concurrent systems for an account, not the number of staff or symbols your organization may operate. Confirm the entitlement and account structure for the intended deployment before building around it.

Check market-data entitlements and transfer constraints
Market-data language must be tied to a market, instrument, timing definition, and plan. For the US market, the cited Alpha Vantage source lists sub-second-latency NBBO quotes, trades and volumes, minute-level aggregates, and market snapshots spanning exchanges, dark pools, and FINRA TRFs. Use the cited latency statement only for the named US-market data; verify network, application, display, order-route, and other-market behavior separately.
Back-testing requires more than a long historical series. Before relying on a backtest, confirm lookback depth, delisted-symbol coverage, and adjustment rules. Alpha Vantage supports split- and dividend-adjusted prices, long historical series, and historical listing-status queries, with some capabilities premium-only. Record which adjustment method, listing status, corporate-action treatment, and paid entitlement were used in the test. Keep the data configuration with the result so another person can reproduce the conditions.
The cited ProRealTime DDE source describes the feature as provided “as is” and without additional customer support. Those conditions mean you should test the actual export workflow on the target operating system, with the target symbols and fields, before depending on it for analysis, reporting, or an internal data pipeline.
A free or low-cost data plan may be suitable for a narrow task and unsuitable for another. Massive’s Stocks Basic plan is listed at $0 and is suitable for reference and historical or end-of-day exploration at a low request rate; real-time trades, quotes, and broader streaming access depend on paid plan entitlements. The $0 figure measures the listed Stocks Basic plan, while the paid-entitlement condition determines whether it can support a real-time or streaming workflow. Verify request limits, fields, coverage, redistribution rights, retention, and support before treating a plan as production-ready.
For every feed, ask for a written answer to these questions:
- Which exchanges, venues, instruments, and currencies are covered?
- Is the data real-time, delayed, end-of-day, or historical, and how is that status exposed?
- What do the timestamps represent, and how are sessions, holidays, corrections, and gaps handled?
- Are prices adjusted for splits, dividends, rollovers, or other events?
- Are delisted symbols and inactive contracts retained?
- Can you store, transform, display, or redistribute the data to internal and external users?
- What happens when a quota, entitlement, connection, or data-quality condition is reached?
Do not let an interface demonstration answer a licensing or data-rights question. Keep those questions as separate approval fields.
Add governance and operating controls before implementation
Automation and algorithmic use require a governance path beyond chart configuration. FINRA reports that examinations and investigations identified shortcomings in some firms’ supervisory controls and procedures for creating, modifying, using, and testing algorithmic strategies, including controls concerning wash sales and excessive message traffic. That US regulatory observation applies to the firms and activities described by FINRA; it is not a finding about every charting product or every organization.
FINRA’s suggested practices for algorithmic-strategy firms cover risk assessment and response, software and code development and implementation, software testing and system validation, trading systems, and compliance. Turn those areas into named owners and review points:
- Risk assessment: define what could go wrong, who is exposed, and how the system is stopped.
- Development: control code changes, dependencies, configuration, and release approval.
- Testing and validation: test normal, boundary, failure, and recovery conditions with representative data.
- Trading systems: monitor messages, orders, positions, permissions, connectivity, and exceptions.
- Compliance: assign responsibility for applicable rules, records, surveillance, and escalation.
The product shortlist should record whether the tool supports the controls your operating model requires. It should not assume that a vendor’s automation feature supplies your organization’s supervisory process.
Add security, privacy, and licensing to the same decision record. Identify the data entering the platform, the people and services that can access it, the credentials or tokens involved, the locations where information is stored, and the parties that can export or redistribute it. Ask for the control evidence and contractual terms required by your organization, then assign qualified owners to assess them. Keep unresolved access, retention, incident, change-management, and market-data-rights questions open until someone with the relevant authority closes them.
Treat trading exposure as a separate readiness gate
Software readiness does not establish financial readiness. Frequent intraday trading can involve losing some or all of an investment, particularly when trading on margin.
Before frequent trading, consider the account type and the percentage of total investment funds allocated to the strategy. Margin trading requires adequate capital and compliance with intraday margin requirements; discuss those requirements with the brokerage firm. Keep this financial decision separate from the software decision. If the workflow involves margin, frequent intraday activity, automated orders, client assets, or a regulated operation, pause production reliance until the relevant qualified financial, brokerage, compliance, and legal reviewers have addressed the exposure.
Use a readiness gate with three outcomes: approved for a defined test, held for qualified review, or rejected for the intended use. Do not increase capital, enable live orders, widen permissions, or turn on automation merely because a chart loads correctly. Record the account, data, execution, monitoring, stop, and escalation assumptions that must remain true for the approved test.
Run a bounded verification before committing
A bounded verification turns the shortlist into a decision record. Choose a small set of representative instruments, users, intervals, data conditions, and workflow actions. Define the pass condition before testing so a polished demonstration cannot substitute for a measurable result. Keep general requirements separate from product-specific observations and record the date, configuration, plan, account, environment, and person responsible for each result.
Run the verification in this order:
- Confirm the task: open the required symbol, interval, chart form, study, drawing, alert, and saved layout.
- Confirm the data: compare timing, price fields, history, adjustments, volume, open interest, and symbol coverage with the requirement.
- Confirm the connection: exercise the API, export, broker, simulated-trading, or execution path that will actually be used.
- Confirm failure behavior: interrupt the network, invalidate a credential in a test environment, exceed a permitted request condition, and restore the connection.
- Confirm permissions: test the roles that can view data, change configuration, run code, submit actions, approve releases, and access records.
- Confirm operations: assign monitoring, support, update, incident, retention, and exit responsibilities.
- Confirm commercial fit: reconcile users, devices, data rights, plan entitlements, fees, and expected growth.
- Record open questions: assign each unresolved item an owner, due date, decision impact, and escalation route.
Keep live trading outside the test unless the responsible reviewers have approved the account, controls, and execution conditions. Use simulated or non-production paths where they answer the question.
Score only after the evidence record is complete. A simple status set is enough: meets requirement, meets with condition, not demonstrated, or does not fit. Do not compensate for a missing market, unresolved licensing term, unsupported export, or untested failure path by awarding extra points for interface polish. The matrix should make trade-offs visible rather than produce a false sense of precision.
Choose the next path from the result:
- Pilot: the required workflow works in a bounded environment, material controls have owners, and remaining questions do not change the pilot boundary.
- Further review: a data, licensing, security, compliance, financial, or integration question could change the production decision.
- Re-scope: the selected product cannot support a required task, so remove that task or return to the shortlist.
- Stop: the intended use depends on an unsupported assumption or creates exposure that has not been accepted by the responsible authority.
Write the decision in the same record as the tests. That record becomes the basis for implementation planning and later re-evaluation.
Prepare a short decision packet before moving from evaluation to delivery. The packet should connect each required capability to a test result, responsible owner, unresolved condition, and proposed boundary. Keep screenshots or output samples beside the configuration that produced them, including the instrument, interval, account type, plan, data entitlement, and environment. A result without those conditions is difficult to interpret and may not be reproducible.
Separate three kinds of open items:
- Blocking items prevent the intended workflow from operating or create an unaccepted control exposure.
- Conditional items permit a limited pilot only if a named restriction remains in place.
- Deferred items do not affect the proposed boundary but require an owner and review point before expansion.
Use that distinction in the recommendation. A product can move to a narrow pilot with conditions, return for review, or leave the shortlist; the decision should follow the unresolved risk rather than the number of features demonstrated.

Bring qualified reviewers into material-risk decisions
Bring qualified reviewers into the decision when the software will influence margin or frequent intraday trading, automated strategies, regulated operations, sensitive information, material account access, client-facing decisions, or the handling and redistribution of market data. The trigger is the consequence of the workflow, not the marketing label attached to the product.
Assign the review to the person with authority over the relevant risk:
- Financial or brokerage review: account type, margin, capital allocation, order permissions, and trading exposure.
- Compliance review: applicable obligations, supervision, records, surveillance, algorithmic controls, and escalation.
- Legal review: contracts, licensing, data redistribution, liability, jurisdiction, and service terms.
- Security and privacy review: identities, credentials, data flows, retention, access, monitoring, incident response, and third-party exposure.
- Engineering and operations review: integration behavior, failure recovery, deployment, observability, support, and exit planning.
Give each reviewer the requirements, test results, unresolved questions, proposed boundary, and requested decision. A general product demo is not a substitute for this role-specific review.
Seek immediate qualified help before enabling a material capability when you cannot explain the data source, execution boundary, account exposure, permission model, or response to failure. Do not proceed on the assumption that a charting vendor, broker, or software team has accepted your organization’s legal, financial, compliance, or security responsibilities. Record the reviewer’s decision and any conditions in the matrix.
Turn the verified matrix into the next project step
The right trading chart software is the product that fits your complete workflow and survives verification across charting, data, connectivity, licensing, operations, and controls. Start with the instruments and user tasks, separate general requirements from dated product claims, test the highest-risk paths, and keep financial and regulatory readiness distinct from interface selection. A shortlist is ready to become an implementation brief when its required capabilities, evidence gaps, test results, owners, and boundaries are explicit.
Bring these items into the next project conversation:
- the users, instruments, intervals, chart forms, studies, alerts, and execution tasks;
- the required data sources, timing, history, adjustments, symbol coverage, volume, and open interest;
- the broker, API, export, platform, account, device, and environment dependencies;
- the licensing, privacy, security, compliance, monitoring, and change-control questions;
- the verification results, unresolved risks, qualified-review decisions, and proposed pilot boundary; and
- the implementation scope, ownership model, acceptance tests, and exit conditions.
That brief gives the delivery team a defined assignment instead of an unbounded tool search. Use it to frame the next delivery discussion.
What should a fintech team verify before relying on trading chart software?
Does chart software for trading include market data and trade execution?
Not necessarily. Charting, market-data access, broker connectivity, and order execution may be separate components or plan entitlements. Confirm the exact instruments, data timing, historical depth, API or export access, broker connection, order types, and permissions included in the configuration you will use.
How can a team verify that trading charts use suitable data?
Test representative instruments against the required real-time, delayed, end-of-day, and historical conditions. Confirm the data source, timestamps, exchange or venue coverage, adjustments, delisted-symbol treatment, volume and open-interest basis, symbol limits, and behavior after a disconnect. Do not treat a chart display as proof that the underlying data is complete or accurate for your workflow.
What should be checked before relying on a charting platform for back-testing?
Confirm the lookback depth, delisted-symbol coverage, corporate-action and adjustment rules, contract or symbol history, data entitlement, and any request or export limits. Record the exact data configuration used, because a back-test result is difficult to interpret or reproduce without those conditions.
When should a trading software evaluation involve financial, compliance, legal, or security reviewers?
Bring in the relevant qualified reviewers before enabling margin or frequent intraday trading, automated orders, regulated workflows, sensitive-data access, client-facing decisions, or market-data redistribution. They should assess account exposure, supervision, records, contracts, licensing, permissions, privacy, security, failure response, and change control before production reliance.